Graphs of Sine and Cosine
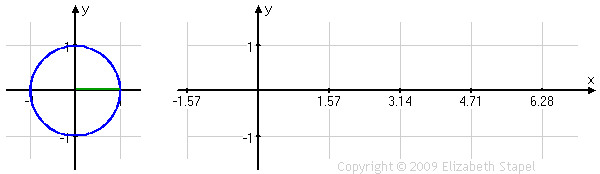
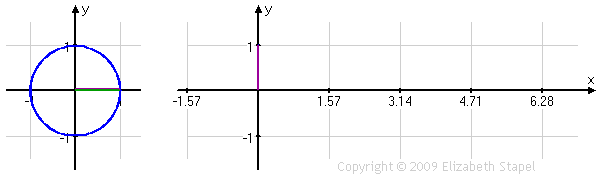
The input x of the graph corresponds with an angle measure in radians on a circle. The output is then the height of the graph. For example, when
π/2 is inserted into a basic sine function (y=sinx), the output gives us the y value of 1 because that is the value found when using the unit circle.
Standard Form: y=asin(bx+c)+d or y=acos(bx+c)+d
Amplitude: The amplitude is the height of the graph, or the distance from the origin to the top or the bottom. Algebraically it is |a|.
Period: The period is the length of one full cycle on the graph (when the graph has gone from the origin to the maximum to the origin to the minimum to the origin or vice versa). Algebraically it is 2π/|b|.
Phase Shift: The phase shift is the starting point of the graph. Algebraically it is -c/b.
Vertical Shift: The vertical shift moves the graph up or down. Algebraically it is what d is equal to.
To graph Sine and Cosine Functions:
1. Identify the amplitude, period, phase shift and vertical shift
2. Label x and y axis. X axis should be labeled with values between -4π to 4π, like 0,π/2,π, etc. The y-axis should use basic values like 0, 1, 2, etc.
3. Take period and divide it by 4.
4. Begin graphing according to the TOBOT and OTOBO rule. If it is a cosine function begin at the Top, zerO, Bottom, zerO, Top. If it is a sine function begin at a zerO, Top, zerO, Bottom, zerO.
5. If the a term is negative, reflect it over the x axis.
Properties of Basic Sine and Cosine Graphs
Domain: All Real Numbers
Range: [-1,1]
Period: 2π
Amplitude: 1
Range: [-1,1]
Period: 2π
Amplitude: 1
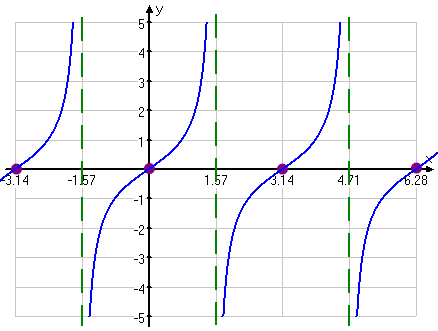
Basic Graph of Tangent
Domain: All Real Numbers except for x=πn/2, where n is odd
Range: (-infinity, infinity)
Period: π
X-intercepts: πn, where n is any integer
Y-intercepts: (0,0)
Extrema: none
Asymptotes: x= πn/2, where n is an odd integer. The asymptotes occur when Cos is equal to zero, because Tan=Sin/Cos, so when Cos=0, the function equals Sin/0 which is undefined.
Range: (-infinity, infinity)
Period: π
X-intercepts: πn, where n is any integer
Y-intercepts: (0,0)
Extrema: none
Asymptotes: x= πn/2, where n is an odd integer. The asymptotes occur when Cos is equal to zero, because Tan=Sin/Cos, so when Cos=0, the function equals Sin/0 which is undefined.
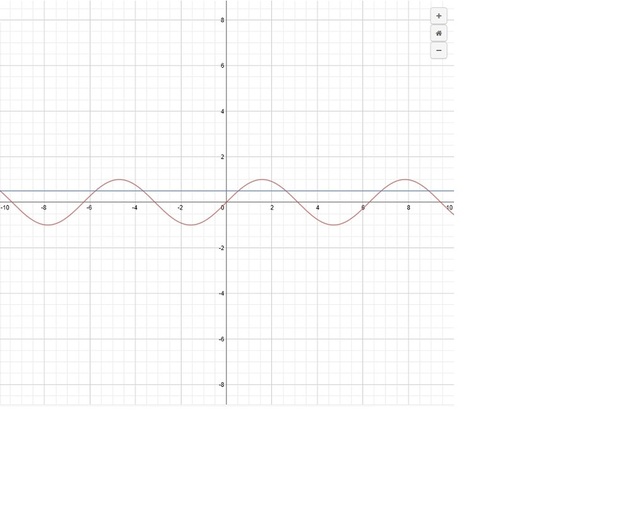
Using Graphs to Evaluate Trig Functions
To evaluate a trigonometric function graphically, set your calculator to function mode and make sure it is set to radian measure. Then plug in both sides of the trigonometric equation given and find where the intersect within the given domain. For example, if your trig function is sinx=.5, when 0<x<π/2, then in the y equals section you would plug in y=sinx for your first equation and y=.5 for your second equation. These equations create the graph below. We then find where the two graphs intersect within the given domain by using the intersection tool on our calculator. We learn that, within the given domain, x=π/6. This method can be used for many different trig functions.
Transformations of Graphs
Transformations of graphs occur when you change the a, b, c, or d values of the basic equation
y=asin(bx+c)+d or y=acos(bx+c)+d.
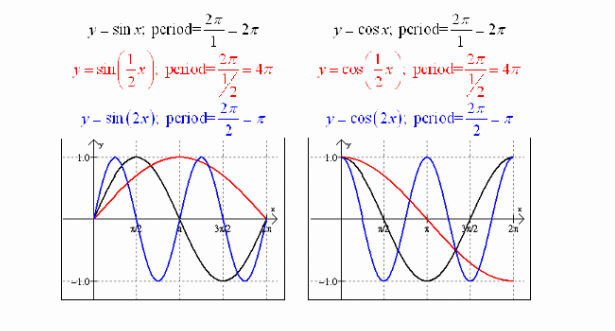
When you change b:
Horizontal shrinks/stretches are related to the period of the graph.
For instance when the basic sine function, y= sinx, is translated to y= sin2x the period becomes π rather than 2π.
y=asin(bx+c)+d or y=acos(bx+c)+d.
When you change b:
Horizontal shrinks/stretches are related to the period of the graph.
For instance when the basic sine function, y= sinx, is translated to y= sin2x the period becomes π rather than 2π.
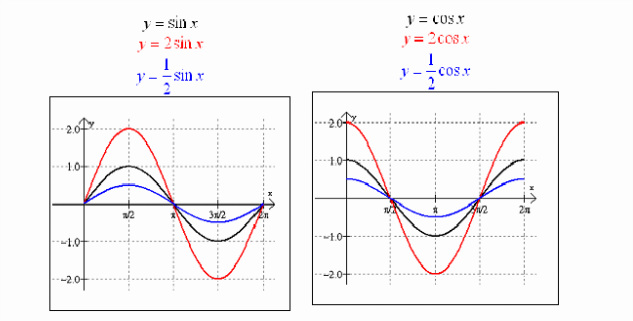
When you change a:
Making a greater makes the heights of the graph increase, and making it smaller makes the height decrease.
Vertical shrinks/stretches are related to the amplitude of the graph.
For example when y=sinx gets translated to y=2sinx the height changes from 1 to 2, and the range switches from [-1,1] to [-2,2].
When you change c:
Changing c affects the phase shift. This can also be seen just as a horizontal shift. A positive value of c will move the graph c units to the right, and a negative value of c will move the graph to the left.
When you change d:
Changing d gives you a vertical shift. A positive value of d will move it up and a negative value will move the graph down.
